Gold just reminded the world why it’s still the “panic button” asset.
In late January 2026, spot gold surged to a fresh all-time high above $4,800/oz, as investors rushed into safe havens amid renewed tariff threats and escalating geopolitical friction. That single price print ignited a bigger question for U.S. gold and silver investors, coin collectors, and bullion buyers:
Is this the start of a new leg higher—or the kind of headline that shows up near a top?
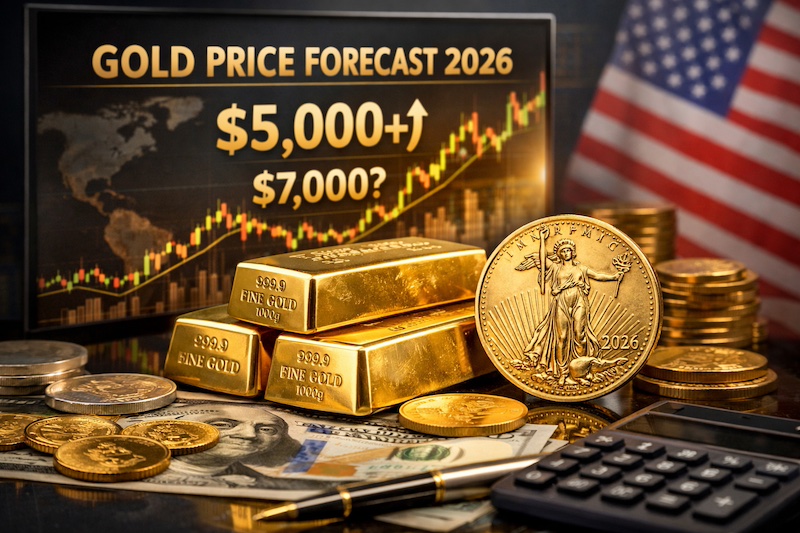
The truth is, both outcomes are possible. But the why behind this rally—real rates, central-bank accumulation, ETF flows, and geopolitical uncertainty—matters more than the day-to-day noise. And those drivers are precisely why many forecasters now see a credible path to $5,000+ gold in 2026, with a few outlier calls reaching toward $7,000 scenarios.
Below is a grounded, investor-focused breakdown of what’s happening, what the credible data says, and how to think about positioning—whether you stack coins, bars, or use paper vehicles like ETFs.
TL;DR (for quick readers)
- Gold hit a record above $4,800/oz amid tariff/trade-war fears and geopolitics.
- The LBMA 2026 Forecast Survey reflects widespread expectations for $5,000+ highs from many analysts.
- The rally’s big drivers: falling/expectations of lower real rates, central bank diversification, and ETF/investor inflows.
- For U.S. buyers, the decision isn’t “all in or all out”—it’s position sizing, product choice (coins vs bars vs ETFs), and a plan for volatility.
Why This Matters Now: A Quick Historical and Market Context
Gold doesn’t need earnings growth to rise—it needs macro stress and shifts in trust.
Historically, gold tends to benefit when:
- Real yields fall (the opportunity cost of holding non-yielding gold declines),
- The U.S. dollar faces diversification pressure, and
- Geopolitical risk pushes investors into liquid hedges.
What’s different about this cycle is who is buying and how persistent that demand has been.
Central banks have been relentless buyers
The World Gold Council reports that central banks bought 1,045 tonnes of gold in 2024, marking a third consecutive year above 1,000 tonnes and far above the 2010–2021 average.
That kind of “official sector” demand tends to be slower-moving—and that can create a sturdier floor beneath the market than a purely speculative retail wave.
Investors are coming back via ETFs
ETF activity is another key difference. World Gold Council research tracks gold ETF holdings and flows as a major channel for both institutional and individual investors.
And by late 2025, global gold ETFs saw strong net inflows (reported as $88.5B in one widely cited World Gold Council-based summary).
Gold Price Forecast 2026: The Case for $5,000 (and Beyond)
Gold at $4,800 sounds extreme—until you realize how many mainstream forecasters are now modeling $5,000+outcomes.
What the LBMA survey implies
The LBMA 2026 Annual Precious Metals Forecast Survey aggregates forecasts from dozens of analysts and provides a public synopsis plus individual outlooks.
LBMA also notes the survey is built for a potentially volatile 2026, reflecting the uncertainty that tends to feed safe-haven demand.
What Reuters reported at the record high
When gold crossed $4,800 in January, Reuters described the move as safe-haven buying tied to heightened geopolitical tensions—spot gold traded around $4,862 after hitting a record intraday peak.
How bullish can it get?
Some strategists have floated upside scenarios well beyond $5,000. For example, a subset of forecasts discussed publicly includes $6,000+ targets, with at least one outlier scenario around $7,000.
These aren’t base cases—but they’re no longer fringe conversations.
Expert take (paraphrased, based on published commentary):
- Analysts at major banks have framed gold as a “high-conviction” long driven by a changing buyer mix—central banks first, then a broader investor pool via ETFs and private capital.
Gold Price Forecast 2026 and Real Rates: The “Hidden Engine” Behind the Rally
If you want one variable that quietly drives gold more than most headlines: real interest rates.
Real rates = nominal yields – inflation expectations. When real rates drop (or are expected to), gold often becomes more attractive because the opportunity cost of holding a non-yielding asset declines.
For data watchers, the St. Louis Fed’s FRED database tracks real-yield series linked to TIPS (Treasury Inflation-Protected Securities), widely used as proxies for real rates.
What this means for investors:
- If markets believe the Fed is moving toward easier policy (or inflation stays sticky while yields slip), that combination can be supportive for gold—even if the economy doesn’t collapse.
Gold vs. Silver in 2026: Different Roles, Different Volatility
Many bullion buyers in the U.S. don’t choose between gold or silver—they own both, for different reasons.
- Gold is primarily a monetary metal and crisis hedge.
- Silver is a hybrid: monetary metal + industrial input (solar, electronics, EV supply chains), which can amplify both upside and downside.
In parts of 2025, silver posted outsized gains versus gold in percentage terms, reinforcing its reputation as the higher-volatility sibling.
Practical takeaway: If gold is your portfolio’s “insurance,” silver is often the “torque”—potentially higher return, but usually a rougher ride.
How U.S. Investors Can Position: Coins, Bars, ETFs, or “A Little of Everything”
Here’s a quick comparison many U.S. investors find useful:
| Vehicle | Best for | Key benefits | Key risks/tradeoffs |
|---|---|---|---|
| Physical coins (e.g., widely recognized sovereign/retail coins) | Coin investors, liquidity-minded buyers | Recognition, divisibility, easy resale | Higher premiums in hot markets |
| Physical bars (1 oz–1 kg) | Bullion stackers, lower premium focus | Often lower premium per ounce | Less divisible; brand/refinery matters |
| Gold ETFs | Convenience + brokerage access | Liquidity, easy rebalancing | Counterparty/structure risk; no direct possession |
| Mining stocks | High-beta exposure | Leverage to gold moves | Company/operational risk; equity market correlation |
A balanced approach many advisors cite
One mainstream guideline often referenced: 5–10% portfolio allocation to gold as a diversifier/hedge (implemented via ETFs or physical).
That’s not a rule—it’s a starting point for risk-aware allocation.
Risks and Reality Checks: What Could Derail the Bull Case?
A professional precious-metals view should include the “bear file,” too.
Risks to the upside narrative
- Real yields reverse higher (gold can struggle if investors can earn attractive inflation-adjusted returns in bonds).
- ETF flows flip negative after a momentum-driven surge.
- Geopolitical risk cools faster than expected.
- Retail FOMO at highs can inflate premiums and increase near-term downside risk if price corrects.
Risks specific to physical buyers
- Premium compression: In mania periods, coin and bar premiums can expand—then normalize even if spot holds.
- Storage/insurance: Physical ownership comes with logistics.
- Liquidity planning: If you might need fast cash, keep your product selection resale-friendly.
Smart Buyer Playbook for 2026: Practical Steps (Not Hype)
If you’re buying into record highs, your edge comes from process.
- Use a staged-buy plan (DCA):
Avoid “all-at-once” decisions near headlines. Spread buys over weeks/months. - Match the product to your goal:
- Coins for flexibility and recognizability
- Bars for lower premium-per-ounce stacking
- ETFs for liquidity and rebalancing
- Track the three drivers that actually move the market:
- Real yields (TIPS proxies)
- ETF flow trend
- Central bank demand cadence
- Have a volatility plan:
Decide in advance what would make you add, hold, or trim—before the next spike hits.
FAQ
1) Is it too late to buy gold after it hits record highs?
Not necessarily—but risk management matters more. Consider staged buying and sizing positions to your time horizon and volatility tolerance.
2) What’s the most credible “gold price forecast 2026” source?
Aggregations like the LBMA Forecast Survey are useful because they compile multiple analysts’ expectations and publish methodology and history.
3) Should I buy gold coins or bars?
Coins tend to be easier to sell in small increments; bars often provide lower premium per ounce. Your choice should match liquidity needs and budget.
4) Are gold ETFs safer than physical gold?
ETFs are convenient and liquid, but they introduce structure/counterparty considerations. Physical removes that layer but adds storage/insurance logistics.
5) What role does silver play alongside gold?
Silver can diversify a metals allocation but usually with higher volatility due to its industrial demand component.
Conclusion: The Opportunity Is Real—So Are the Risks
The 2026 gold story isn’t just a price chart flex. It’s a macro narrative: central banks buying at scale, investors returning through ETFs, and geopolitics keeping the safe-haven bid alive.
The market may well see $5,000+ prints if those tailwinds persist—and the LBMA survey shows plenty of analysts are willing to put that on paper. But for U.S. coin investors and bullion buyers, the winning move usually isn’t predicting the exact top—it’s building a position responsibly:
- buy in tranches,
- choose products you can resell easily,
- and treat gold as a strategy, not a headline.
Optional call-to-action: If you’re considering adding exposure, start by defining your allocation target and choosing the vehicle (coins, bars, ETFs) that best fits your liquidity and storage preferences—then execute with a staged plan.