Silver just did the thing it always does late in a precious-metals run: it went from “strong” to stretched in a hurry.
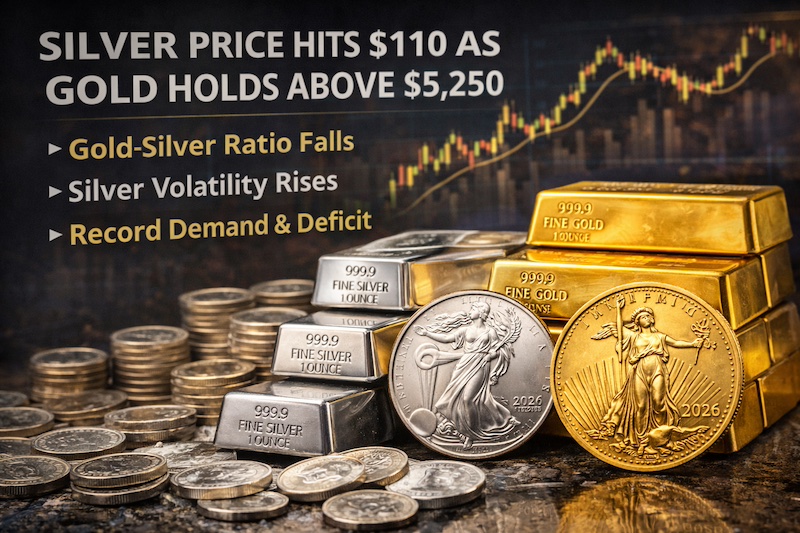
When silver price hits $110 and headlines start sounding breathless, the opportunity isn’t only in the move itself—it’s in how you manage what typically comes next: bigger daily swings, wider spreads, and a market that punishes emotional decision-making. CoinWeek’s latest bullion report pegged silver above $110/oz with momentum “strong but increasingly stretched,” while gold climbed above $5,250, reinforcing gold’s steadier “store of value” identity even as some geopolitical pressures eased.
For U.S. gold and silver investors, coin buyers, and bullion stackers, this is the moment to zoom out. Why? Because silver’s surge is happening alongside structural demand narratives (industrial consumption, supply constraints) and the kind of ratio and positioning signals that often show up near the more volatile phases of a bull market.
TL;DR
- Silver price hits $110 and appears historically stretched versus gold, which often increases volatility risk.
- Gold above $5,250 has looked steadier by comparison; the World Gold Council cited a January 2026 record high $5,307/oz (LBMA Gold Price PM, USD).
- A falling gold-to-silver ratio can signal silver outperformance, but it also tends to coincide with late-cycle froth and sharp pullbacks.
- Silver’s fundamentals aren’t just investor-driven: the Silver Institute reported record industrial demand of 680.5 Moz in 2024 and a 148.9 Moz market deficit.
- Best approach: treat gold and silver as different tools—gold for stability, silver for torque—and size positions accordingly.
The Big Picture: Why This Rally Matters Now
CoinWeek’s framing is clean: silver is powerful but overheated, gold is firm and structurally supported. That distinction is crucial because it shapes how the market behaves.
Gold’s “structural bid” has been harder to shake
Gold is benefiting from longer-term concerns around currency stability, fiscal trajectories, and supply constraints—drivers that don’t disappear just because a headline cools off. The World Gold Council’s January 2026 commentary (based on the LBMA Gold Price PM) documented a remarkable month across major currencies and a USD record high of $5,307/oz on Jan. 28, 2026.
Silver’s “dual identity” is a blessing and a curse
Silver has monetary-metal psychology and industrial-metal fundamentals. The Silver Institute reported that industrial demand rose to 680.5 million ounces (Moz) in 2024, a record high, while the market still posted a 148.9 Moz deficit in 2024 (and is expected to remain in deficit even if it narrows).
That combination can justify upside—but it also makes silver more prone to air pockets when speculative positioning gets crowded.
Silver Price Hits $110: Why the Move Looks Historically Stretched
CoinWeek noted that silver’s rally has pushed it “far beyond historical norms relative to gold,” pointing to a sharply lower gold-to-silver ratio—something that “typically appears late in precious-metals bull markets.”
What the gold-to-silver ratio is really telling you
The gold-to-silver ratio is simply how many ounces of silver equal one ounce of gold. Investors watch it because it can highlight when one metal looks relatively expensive/cheap versus the other. Investopedia notes the ratio has been volatile in the modern era and has averaged around ~65:1 since the 1970s, while spiking to extremes in stress periods.
When the ratio drops quickly, it often means silver is outperforming aggressively—great if you’re already positioned, risky if you’re chasing.
Technical overheating + speculation = whiplash risk
CoinWeek also highlighted classic late-stage conditions:
- silver trading well above long-term averages
- speculative interest building
- higher risk of sharp pullbacks even if the trend remains intact
You can sanity-check “speculative interest” using public positioning data like the CFTC’s Commitments of Traders (COT) releases, which track how different trader categories are positioned in futures markets. (Many platforms summarize these weekly for investors, but the CFTC is the source of record.)
Practical translation: once the silver trade becomes crowded, price can fall faster than fundamentals change—because positioning unwinds.
Gold Above $5,250: Why Gold Has Looked Steadier
CoinWeek’s view is that gold’s strength reflects concerns about currency stability, fiscal policy, and longer-term constraints—more structural than speculative. The World Gold Council’s January 2026 note adds context: gold’s rise came amid mixed macro signals, with attention shifting between geopolitics and inflation/fiscal dynamics.
In plain English: gold can trend higher even when fear cools, as long as the market still questions real purchasing power and policy credibility.
Gold vs. Silver at These Levels: A Simple Buyer’s Comparison
Here’s the lens I use when coaching retail bullion buyers through “new territory” markets:
| Feature | Gold | Silver |
|---|---|---|
| Market role | Wealth preservation / reserve-like hedge | Higher beta hedge + industrial commodity |
| Typical volatility | Lower | Higher (often much higher) |
| What drives spikes | Macro, real rates, currency confidence | Macro + positioning + industrial narratives |
| When it gets dangerous | When buyers rely on leverage or FOMO | When momentum gets “stretched” and crowded |
| Best use case | Core holding | Satellite/tactical holding |
Bottom line: If gold is the portfolio’s seatbelt, silver is the turbocharger. Don’t size them the same.
The Industrial Case Study: Why Silver Can Stay Elevated Longer Than You Think
One reason silver can defy “overbought” signals is that the physical market has real pull from industry.
The Silver Institute reported:
- industrial demand up 4% in 2024 to 680.5 Moz (record)
- 2024 market deficit 148.9 Moz
- and expectations for deficits to persist (though potentially narrowing).
That matters because industrial users often buy based on production needs and supply chain considerations—not investor sentiment. When you combine that with investor flows, silver can get “stuck high”… until it suddenly isn’t.
The Risk Side: What Usually Breaks a Silver Momentum Run
Even silver bulls should respect the downside mechanics. Here are the common tripwires:
1) Profit-taking cascades
Silver’s smaller market size and higher volatility mean it doesn’t take much selling to accelerate declines. MoneyWeek documented a vivid example of early-2026 whipsaw behavior—silver hitting a new high and then dropping sharply in days.
2) Dollar strength / rates repricing
A stronger U.S. dollar can pressure commodities broadly, and rate expectations can quickly change the opportunity cost narrative. (Gold often holds up better than silver in these “tightening impulse” episodes.)
3) Positioning unwind
When speculative interest builds, an adverse move can trigger forced selling and margin calls—turning a pullback into a flush. COT data is one way to keep an eye on this risk regime.
Silver Price Hits $110: What to Do if You’re Buying Physical Bullion
This is where most U.S. buyers can add real edge—by focusing on process instead of prediction.
A disciplined 5-step playbook
- Decide your role for silver (core vs tactical).
If you can’t tolerate 20–35% drawdowns, don’t size it like gold. - Use tranches (DCA) instead of lump-sum buys.
When CoinWeek says “stretched,” assume volatility. - Track premiums, not just spot.
In fast markets, retail premiums can widen. Know your “walk-away” premium levels. - Choose liquidity-first products.
For U.S. buyers: widely recognized sovereign coins and standard bars tend to be easiest to sell when spreads widen. - Have a sell/trim rule.
Even if you’re long-term bullish, define what “too much” looks like (allocation % or profit target) before the next spike.
FAQ
1) Does it matter that silver price hits $110 if I’m a long-term holder?
Yes—because entry price affects your volatility experience and your ability to add on dips. When silver is historically stretched, swings tend to get larger.
2) What does a falling gold-to-silver ratio mean?
It generally means silver is outperforming gold. But rapid ratio drops can also coincide with late-stage bull-market behavior and higher pullback risk.
3) Why is gold above $5,250 holding up even as geopolitics eases?
Because gold is also reacting to deeper drivers like inflation/fiscal uncertainty and currency confidence—not just headlines.
4) Is silver’s industrial demand story real or hype?
It’s real. The Silver Institute reported record industrial demand of 680.5 Moz in 2024 and a 148.9 Moz deficit in 2024.
5) Should I buy silver coins or bars at these levels?
If you’re purely stacking ounces, bars often offer lower premium per ounce. If you want flexibility and easier resale, widely recognized coins can be worth the premium—especially in volatile markets.
Conclusion: Treat This as a Risk-Management Moment, Not a Prediction Contest
When silver price hits $110, the question isn’t “Will it go higher?” It’s “Can I handle what silver usually does at extremes?” CoinWeek’s message is clear: silver looks historically stretched and volatility risk is rising, while gold looks steadier and more structurally supported above $5,250.
If you’re a U.S. bullion buyer, the smart move is to:
- size silver appropriately,
- buy in tranches,
- focus on liquidity and premiums,
- and keep gold as the anchor if your goal is long-term wealth defense.
Optional call-to-action: Write down your target allocation (gold vs silver), your acceptable premium range, and your plan for adding or trimming—before the next big swing forces a decision.